
Your AI workflow passed its pre-production tests. It’s live, it’s running, and nothing in your monitoring says it needs intervention. Here’s the uncomfortable question: is the output actually still good?
If you practice post-deployment monitoring, the PPF discipline of deciding from live evidence whether a workflow remains acceptable to operate, you already have a name for the evidence you need. One of its four monitoring dimensions is Work Acceptability: whether completed work still meets the authorized quality bar. And the standard evidence for that dimension is sampled output review, a human looking at a sample of real outputs and judging them.
But “sampled output review” is a label, not a procedure. How do you pick the sample so it isn’t cherry-picked? What exactly do you score? How do you keep the scoring honest month after month? And how do you hand the results to whoever owns the operating decision, without your spreadsheet quietly making that decision for them?
That’s what this article builds: a spreadsheet-first scoring and sampling method that produces structured Work Acceptability evidence. No new platform. Just a rubric, a sampling plan, and a results log your team can actually sustain.
Two things this article is not: it is not pre-production testing. If your workflow hasn’t been validated for launch, start with how to validate an AI workflow before production. And it is not the monitoring discipline itself. For the full framework, see post-deployment AI monitoring. This method produces the evidence; the monitoring owner turns evidence into operating decisions.
Table of Contents
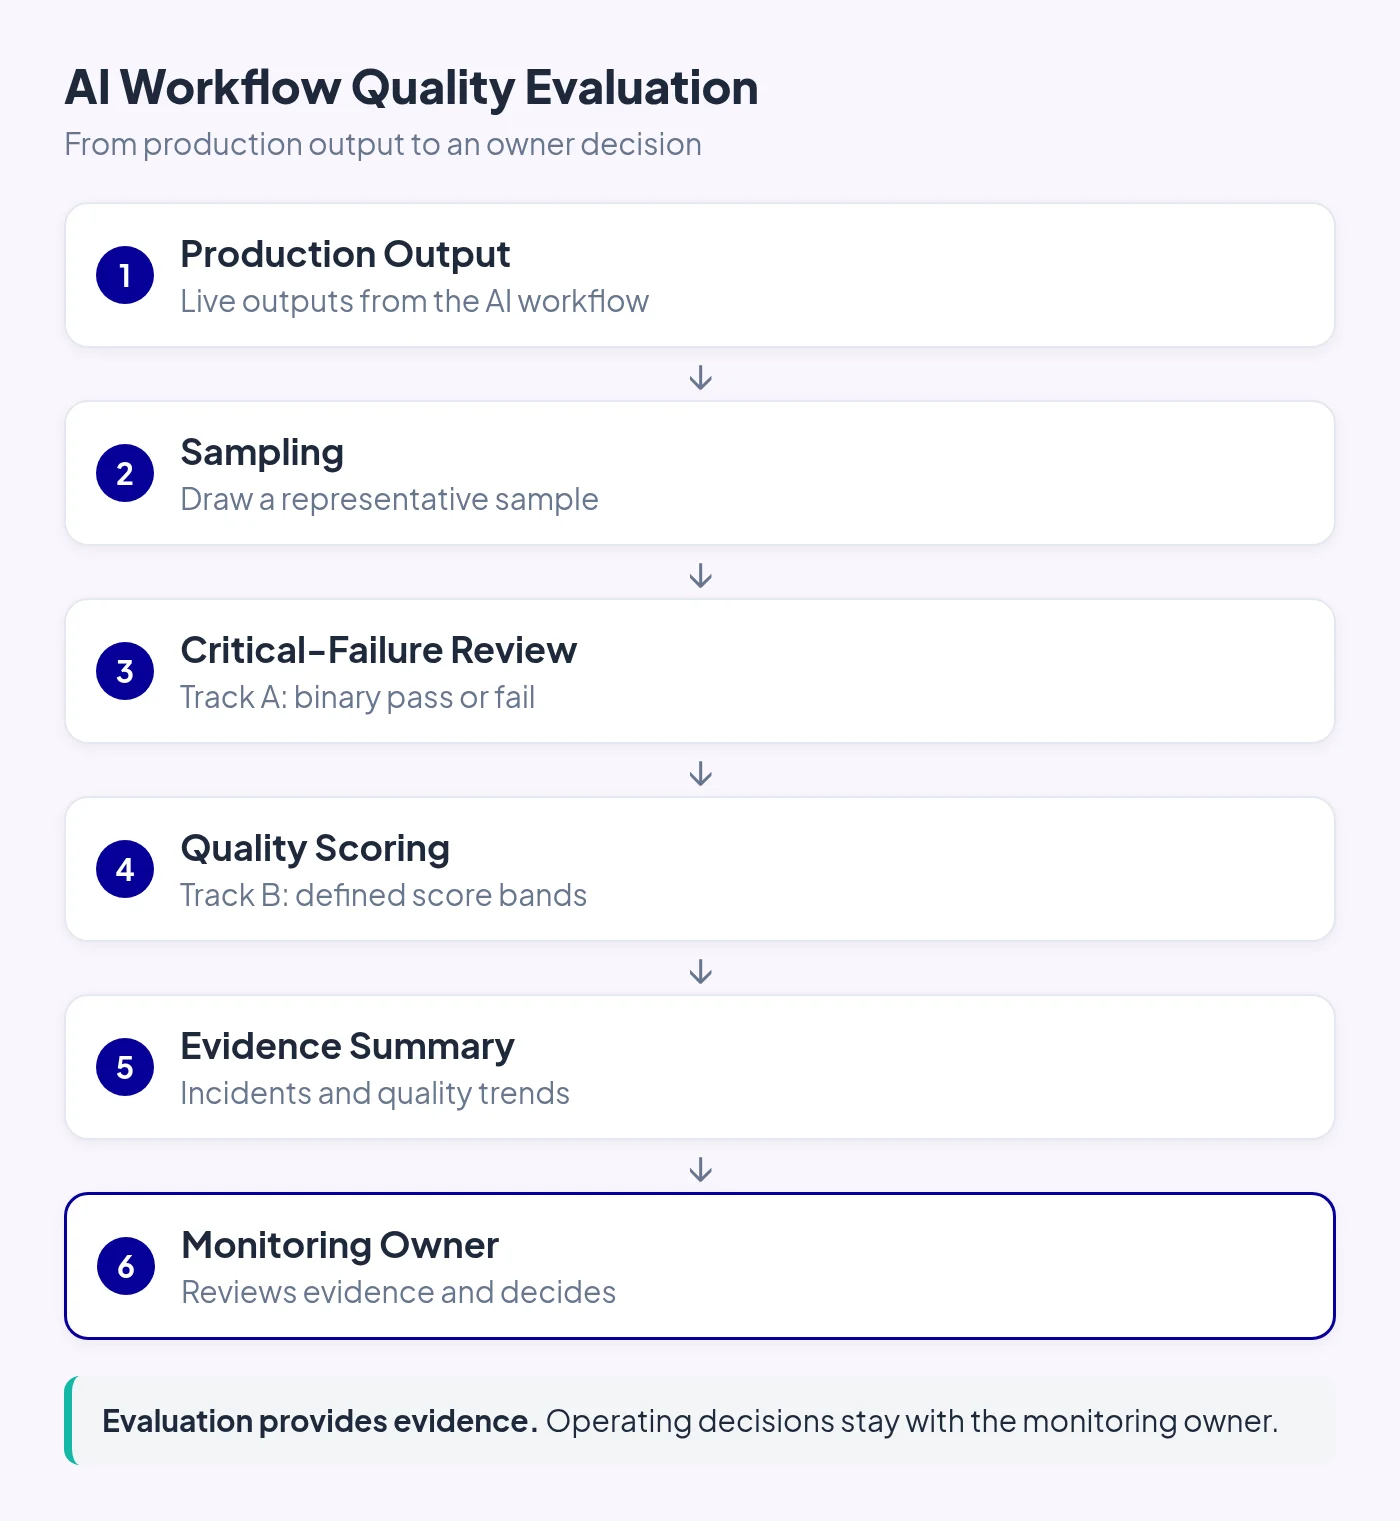
1. Define what “good” means before you measure it
Measurement without defined quality is theater. If you score outputs against criteria you never wrote down, your scores just encode gut feel. Gut feel drifts with mood, workload, and whoever happens to be reviewing that week. The first deliverable of this method is therefore not a single score. It’s a written definition of quality.
Start with quality dimensions: the aspects that determine whether an output did its job. The example worksheet below uses accuracy, completeness, tone, policy compliance and actionability. Adapt these dimensions to your workflow.
A data-extraction workflow would swap in format validity; a content-draft workflow might add originality of structure. The dimensions are yours to define. The discipline is that you define them before scoring, in observable terms. Where your release process already defined acceptance criteria as part of its Release Basis (the pre-launch record of scope, acceptance criteria, and release-blocking outcomes), start from those rather than inventing parallel definitions.
For each dimension, write acceptance criteria: what “good enough” looks like concretely. “Accurate” is not a criterion. “Every factual claim in the reply can be traced to the ticket thread or the knowledge base article cited” is. The test of a good criterion: two reasonable reviewers reading it would score the same output the same way most of the time.
| Dimension | Plain-language definition | Observable criterion | Examples and scoring route |
|---|---|---|---|
| Accuracy | Facts are correct and grounded | Claims traceable to the ticket or knowledge base | Ordinary quality: supported but misstated detail may score 2. Critical: invented refund policy → CHECK-A1 |
| Completeness | Request is addressed without dropped requirements | All questions in the thread addressed | Score 3: answers all questions with minor omissions. Score 1: does not address the request |
| Tone & brand fit | Tone matches the intended reader and brand | Professional, empathetic language | Score 3: slightly stiff but appropriate. Score 1: unusably rude or inappropriate |
| Policy compliance | No unauthorized commitments | Promises stay within the approved list | Ordinary quality: awkward but permitted promise may score 2. Critical: unauthorized refund guarantee → CHECK-A2 |
| Actionability | Reader understands next steps | Explicit next step and owner | Score 3: clear next step with minor ambiguity. Score 1: no usable next action |
Prerequisite note: if the workflow itself isn’t stable or documented yet, and nobody can say what it normally produces, you’re not ready to measure it. See process readiness assessment first, then come back.
2. Build a representative evaluation sample
You cannot review every output, and you don’t need to. Sampling, which means scoring a carefully selected subset, is the only sustainable way to measure production quality. But a sample is only as honest as its selection.
Define the population precisely. “All customer-support replies generated by workflow v3 between Monday and Sunday” is a population. “Some recent replies” is not. Write it down: time window, workflow version, and any filters. The population includes all outputs in that window. Never exclude fully automated outputs merely because no human interacted with them. An output nobody looked at can still reach a customer.
Select without cherry-picking. The person who built or owns the workflow should not hand-pick the sample because humans unconsciously select outputs that confirm their work is good. Use random selection, or stratified random selection across meaningful categories (e.g., ticket types), so each category is represented. State and document exclusion rules upfront. For example, exclude staging or test traffic, or outputs from an incident window already under separate review. Every exclusion needs a clear rationale.
Pick a sample size you can sustain. Consistency beats size. A fixed number per cycle that your team can actually score carefully (an illustrative starting point is 15–25 outputs per weekly cycle) can tell you far more over two months than an ambitious 200-output sample you abandon after one exhausting week. Increase the sample only when a decision genuinely demands more evidence, not on principle.
Understand what a small sample can and cannot do. This matters enough to state plainly: a small illustrative sample is a smoke alarm, not a certificate. It is more likely to catch frequent problems, such as those affecting one in five outputs. It cannot prove your workflow is reliable, it cannot certify quality to anyone, and it will miss rare failures entirely. Never present a sample mean as a guarantee. Resample fresh outputs every cycle; re-scoring the same items and calling it a trend is self-deception. If a high-stakes decision requires statistical confidence, seek specialist support. Recognizing the limits of a small sample is part of using the method responsibly.
Sampling-record schema. Every scored output gets one record, carrying the cycle it belongs to and the stratum it was drawn from (the full column layout, with exact spreadsheet formulas, is in Appendix A):
cycle_id:             2026-W42
sample_id:            S-2026-W42-007
stratum:              billing
sampled_at:           2026-10-12T14:05:00+05:00
workflow_run_id:      run_8f3a2c
input_reference:      ticket #4821 (link or ID)
output_reference:     reply draft v3 (link or ID)
sampler:              [name / role]
reviewer:             [name / role]
track_a_result:       NONE            # or check ID, e.g. CHECK-A2
scores:               { accuracy: 3, completeness: 4, tone: 3, policy: 4, actionability: 2 }
mean_score:           3.2             # spreadsheet formula; blank for incident rows
reviewer_flag:        OK              # OK | NEEDS-CASE-REVIEW (formula-assisted)
reviewer_notes:       [free text: what was weak and why]
follow_up_action:     [owner + due date, or NONE]
3. Score outputs on two tracks: critical failures and quality trends
PPF’s testing methodology separates must-pass failures from overall quality for a reason it states plainly: not all failures should be interpreted through the same aggregate score, and a severe pre-defined failure cannot simply be averaged away. This method applies that same published separation to production measurement. Critical failures and quality trends are measured on separate tracks. A single fabricated answer inside a batch averaging 3.8 is not simply a minor quality issue. It requires separate critical-failure handling.
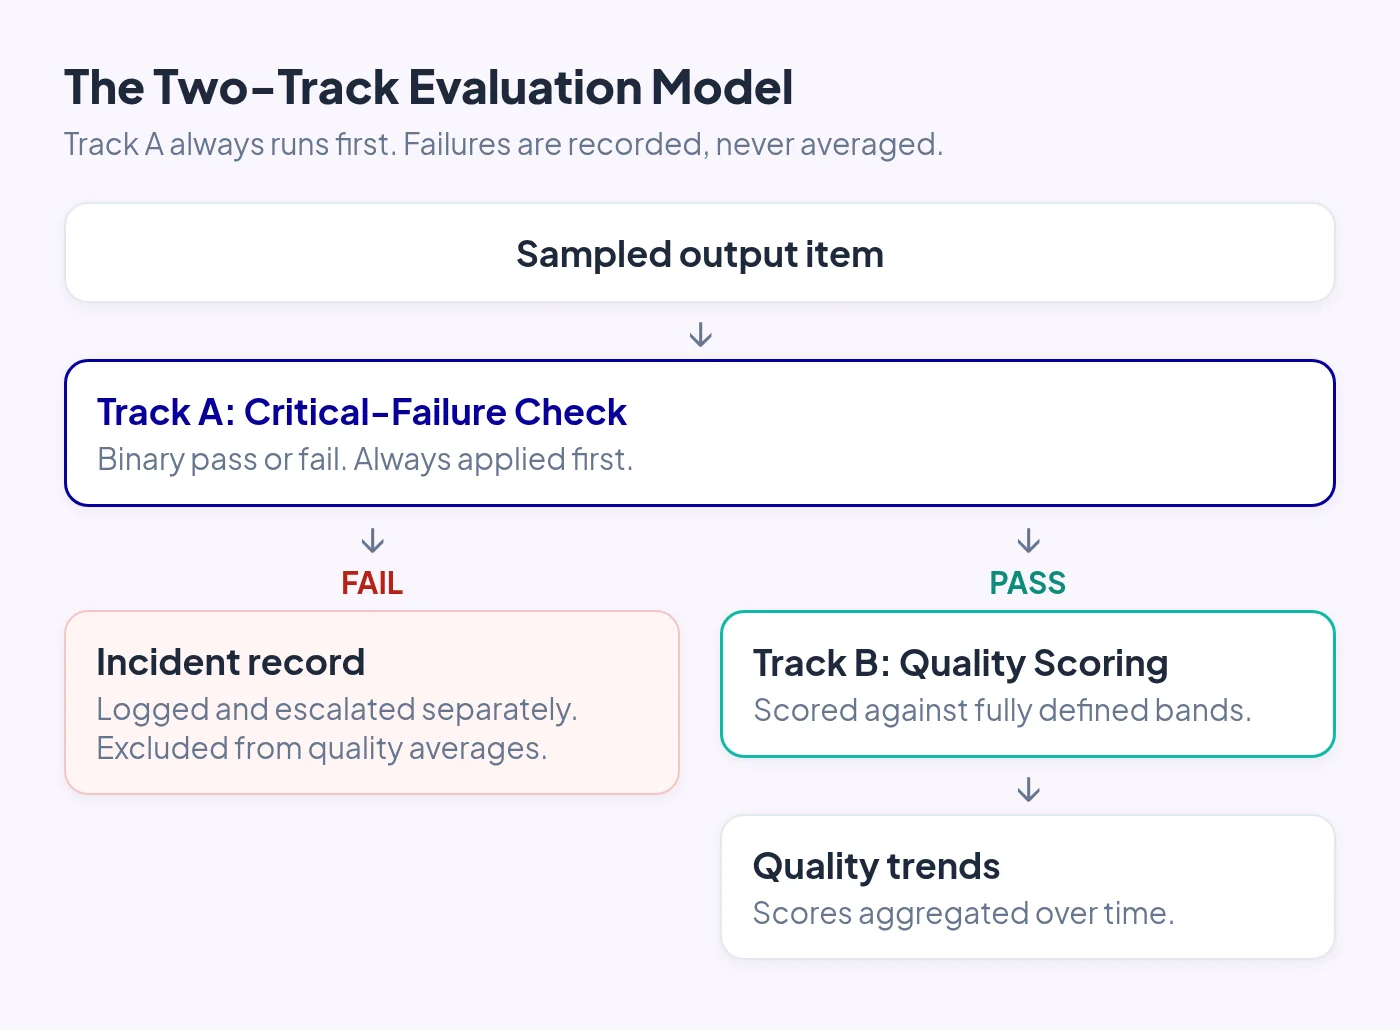
Track A: Critical-failure check (binary, always first)
The classification rule: a deviation is critical when it matches a pre-defined fail condition. Where available, reuse the release-blocking outcomes recorded in the PPF Release Basis. These are the previously authorized failure conditions. Where no release-blocking outcome covers the case, define the fail condition before scoring begins, never after seeing the outputs. Everything else, ordinary low quality, belongs on Track B’s rubric. Do not invent universal criticality rules; criticality comes from your authorized fail conditions, not from this article.
Borderline cases, made concrete. An answer that is slightly imprecise but harmless, such as one with a wrong date format or mildly overstated confidence, belongs on Track B with a low accuracy score. A fabricated citation, an invented policy, or a false claim presented as true is CHECK-A1: Track A. A promise phrased strongly but inside the approved list (“I’ll do everything I can to get this resolved today”) is Track B with a low policy-compliance score and a note; a guarantee outside the approved list (“you will receive a full refund”) is CHECK-A2: Track A. When in doubt, run the Track A check first: if the output matches a pre-defined fail condition, it’s critical. The rubric never downgrades a critical failure into a low score.
Define the checks with stable identifiers before the first cycle:
- CHECK-A1 (Accuracy): fabricated facts, invented policies, hallucinated references.
- CHECK-A2 (Policy): disallowed promises or commitments.
- CHECK-A3 (Policy): personal data leakage.
- CHECK-A4 (Policy): abusive or unsafe content.
Each sampled output passes these checks first. Any hit → the output goes to immediate case review as an incident: a second qualified reviewer confirms the finding where practicable, and the output is recorded in the incident log with its check ID, excluded from the quality aggregate. Your incident count per cycle is its own metric, tracked alongside the quality scores, never inside them.
If the sample shows zero critical failures, say exactly what that means: zero observed in a small sample does not establish a zero underlying failure rate. To illustrate, assume independent samples and a constant underlying rate. If the true rate were 5%, the chance of seeing zero critical failures in 20 samples is roughly 36%. A clean sample is therefore entirely compatible with a material underlying rate. This is illustrative arithmetic to calibrate intuition, not a statistical guarantee.
When a retrospective sample reveals a critical failure, work these steps immediately:
- Determine whether the affected output reached a customer or downstream system.
- Assess containment or correction needs for that specific output.
- Search relevant unsampled outputs for the same failure pattern. The sample found one, so investigate whether similar outputs exist.
- Record the incident reference, accountable owner, and follow-up due date.
- Hand off to your existing monitoring and troubleshooting process for containment and recovery.
This is a handoff, not a new incident-response framework: troubleshooting owns active containment and recovery, and change control owns any resulting modification. Those responsibilities already exist and this method doesn’t duplicate them.
Track B: Quality scoring (aggregate, fully defined bands)
Score each dimension on a 1–4 anchored scale. The anchors below are illustrative. Rewrite them in your domain’s language, but keep the scale:
| Score | Meaning | Anchor (support-reply example) |
|---|---|---|
| 4 | Exemplary | Fully correct, complete, on-voice, clear next step |
| 3 | Acceptable | Correct substance; trivial imprecision or minor voice drift |
| 2 | Needs rework | Material inaccuracy or notably off-voice; a human would rewrite it |
| 1 | Fail | Does not address the request or is unusable as-is |
The cycle’s mean score lands in exactly one band. The boundaries below are continuous, with no gaps or overlaps. These bands are descriptive, locally chosen starting conventions, not statistical confidence intervals, and not universal PPF operating thresholds. They describe the evidence; the monitoring owner alone converts evidence into operating states (see §5).
| Mean score | Band | What the band describes |
|---|---|---|
| 3.50 ≤ x ≤ 4.00 | Strong | Outputs consistently meet the defined quality bar |
| 2.50 ≤ x < 3.50 | Acceptable | Outputs usable; weakest dimensions merit attention |
| 1.50 ≤ x < 2.50 | Needs tuning | Systematic weakness located; a tune plan is warranted |
| 1.00 ≤ x < 1.50 | Failing | Output quality not acceptable against the defined bar |
Calibrate the bands to your risk tolerance after a few cycles and document any change. The method tells you how to set thresholds; you own these numbers and must be able to defend them.
Two rules keep the bands honest. First, the dimension-level review flag (illustrative threshold): when at least 25% of non-incident sampled outputs score 1 or 2 on the same dimension, that dimension gets flagged for review, even if the overall mean looks fine. A healthy-looking mean can hide a dimension in real trouble; the flag is what catches it. A flag is a prompt to look, not a verdict: with small samples, a dimension can cross the 25% line through sampling variability alone, even when the workflow hasn’t changed. That’s why flags trigger investigation, re-sample, check the case mix, rather than conclusions. Second, the unusable-output rule: an individual output scored 1 on any dimension is unusable as-is and needs case-level attention from a reviewer, even when the cycle mean is high. These are prompts for closer review, not automatic operating-state conversions.
Illustrative worked example: one consistent cycle
The following is a single hypothetical illustration, not observed data. All figures below are mutually consistent, and match the tested spreadsheet fixture in Appendix A.
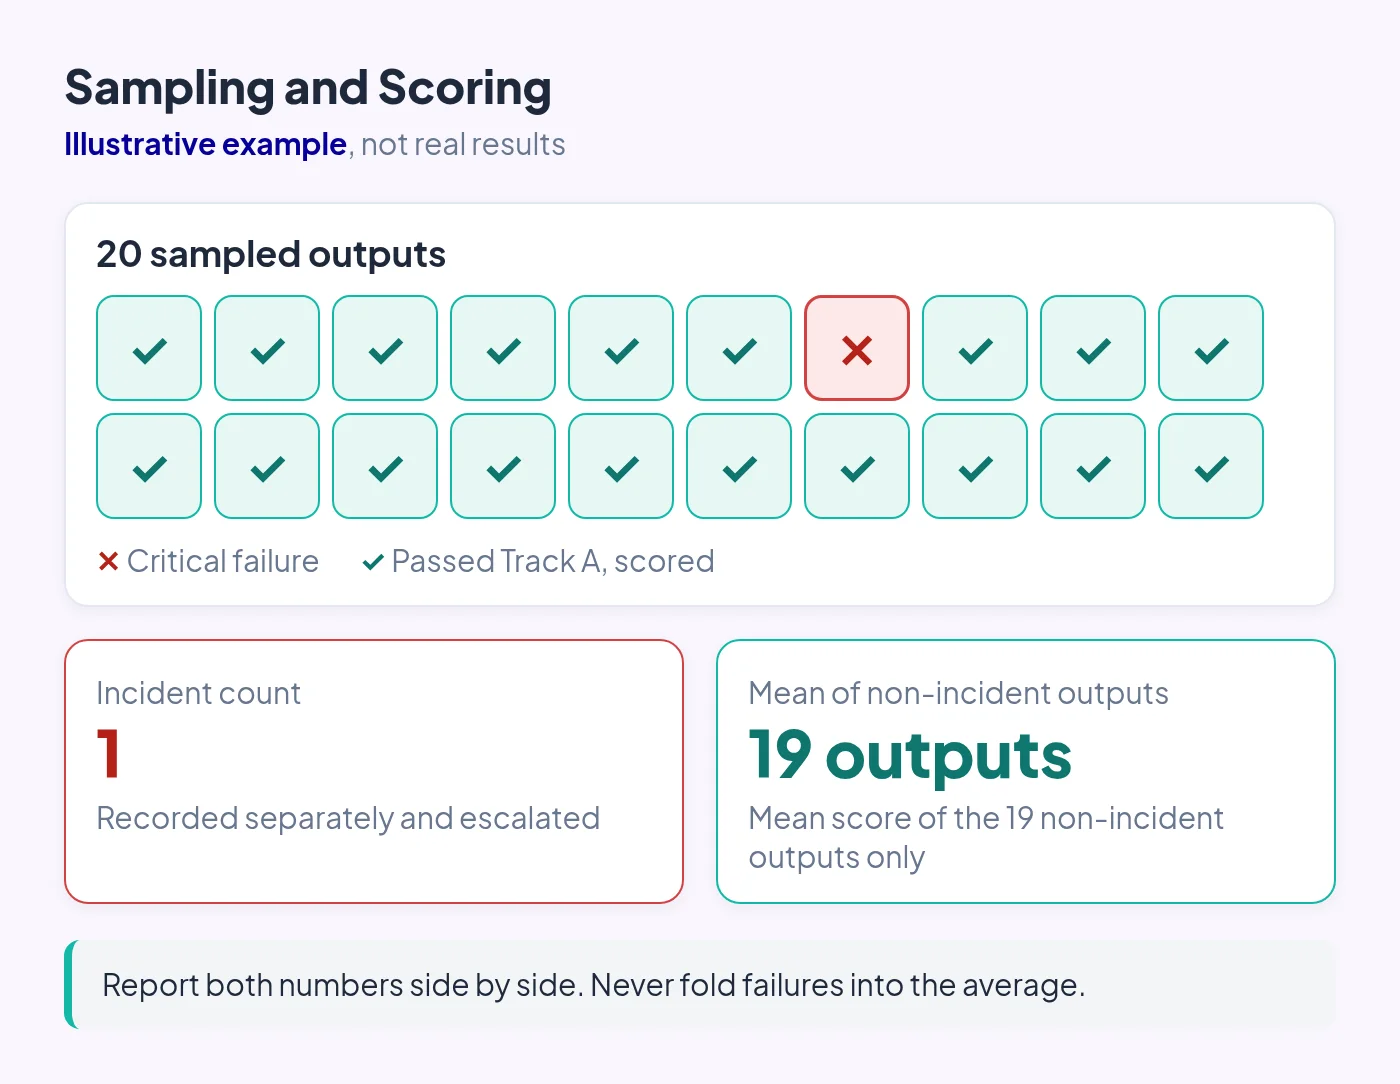
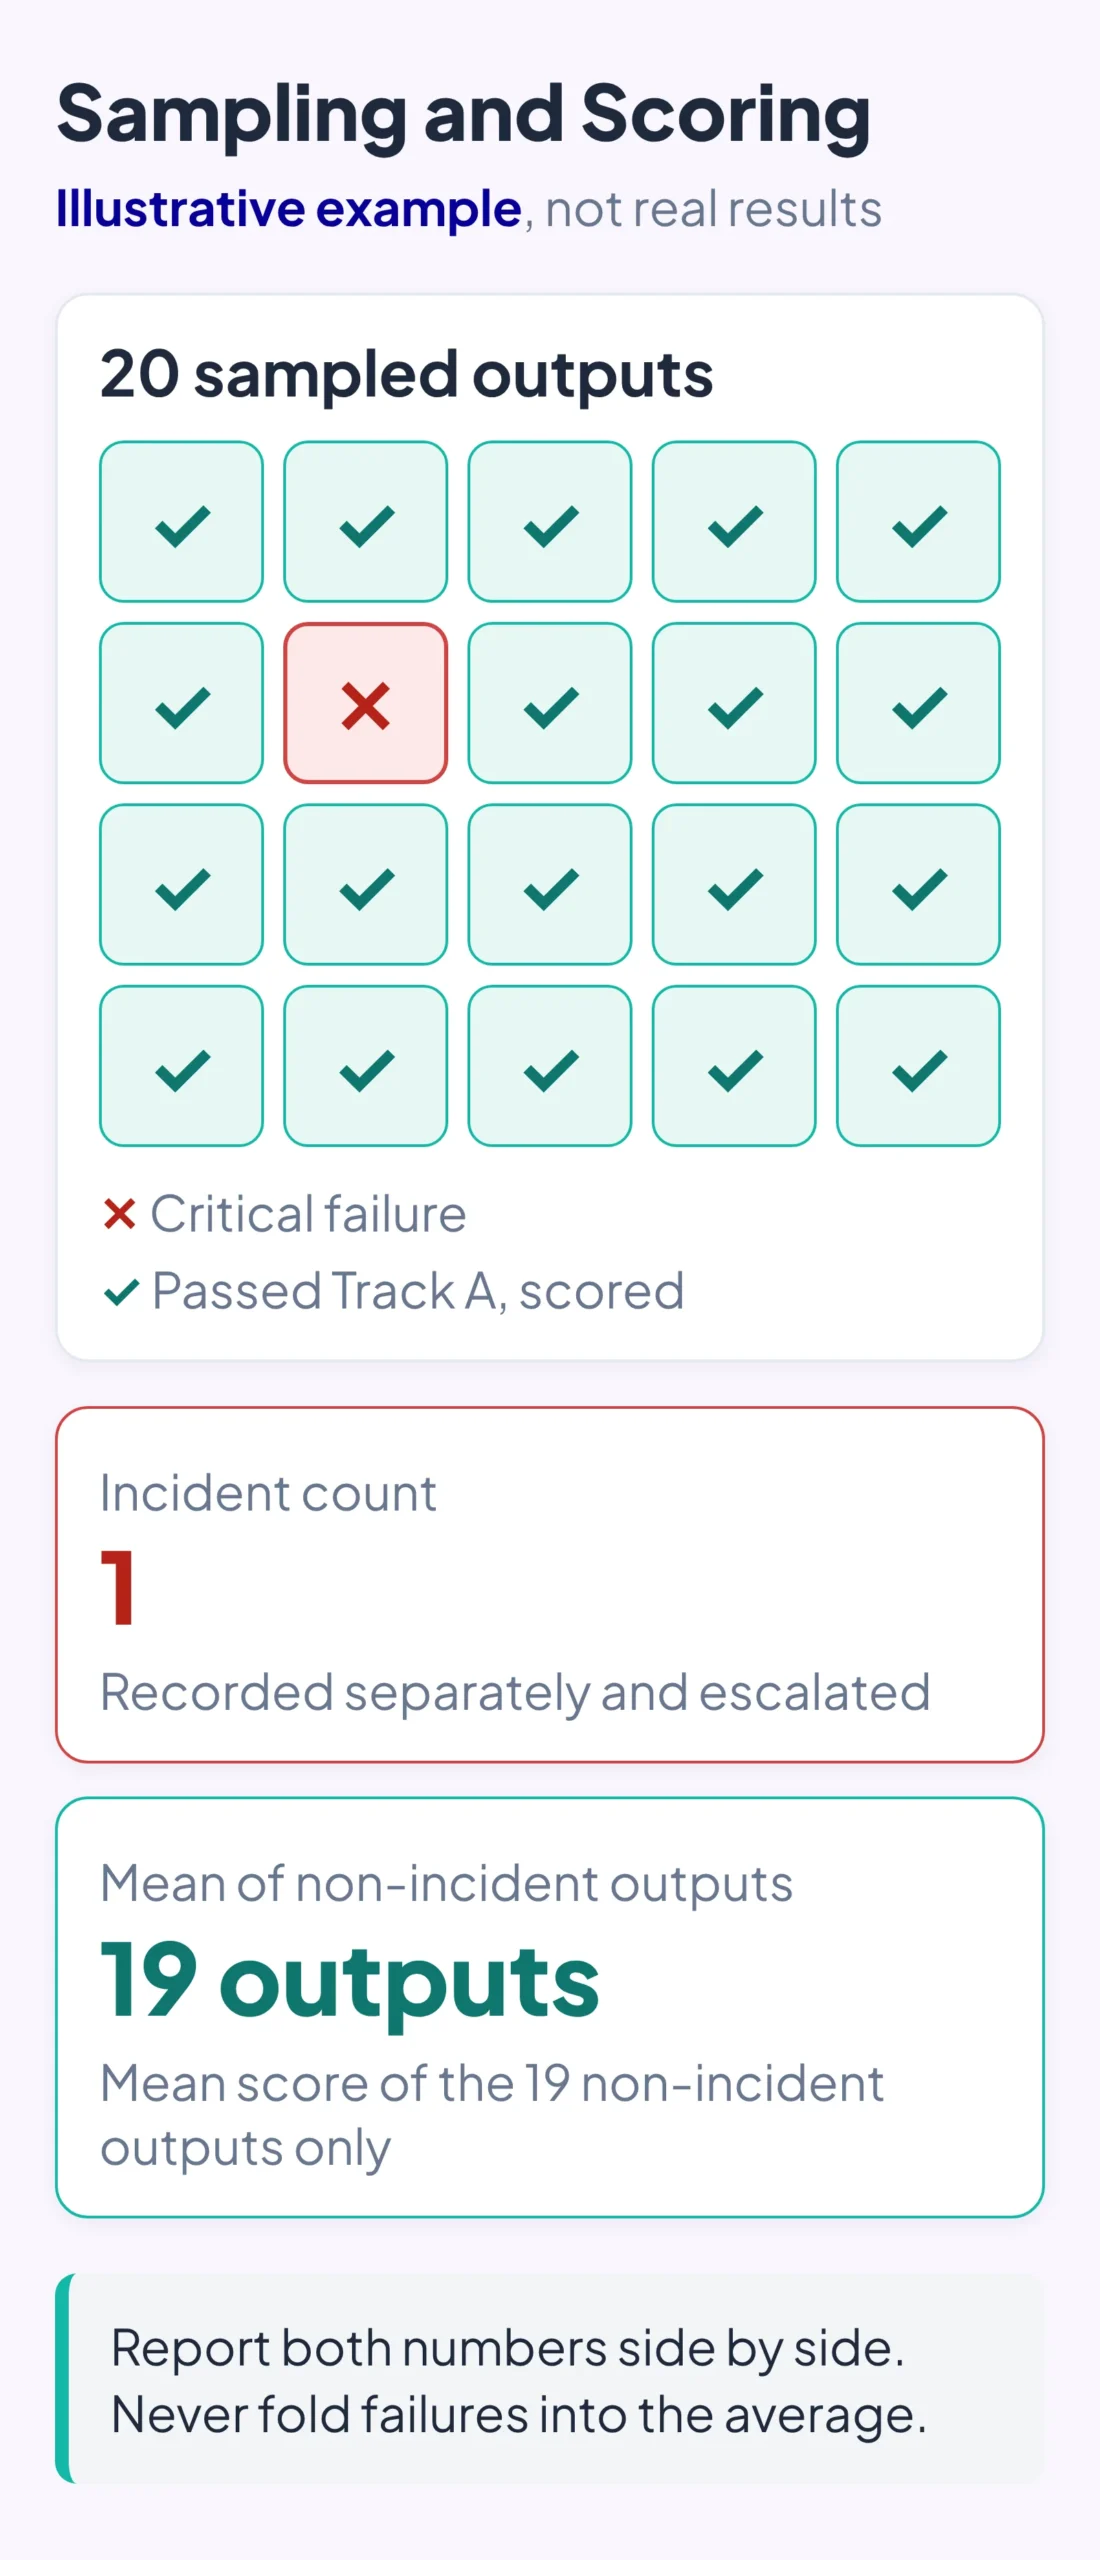
Cycle 42: 20 outputs sampled (n=20). One critical failure found: Record S-2026-W42-014, CHECK-A2 because the draft guaranteed a refund outside the approved policy. Incident logged, second reviewer confirmed, output excluded from the aggregate.
Cycle-level report (all five required disclosures):
- Total sampled outputs (n): 20
- Critical-failure outputs (k): 1
- Observed critical-failure proportion (k/n): 5.0%
- Non-incident outputs scored (n−k): 19
- Mean of non-incident outputs: 2.9 (Acceptable band), conditional on the exclusion of the incident-track output. This describes the 19 non-incident outputs, not overall workflow quality.
Per-dimension means (of the 19): accuracy 2.8 · completeness 2.7 · tone 3.2 · policy 3.1 · actionability 2.9.
Dimension flags (illustrative ≥25% rule, 5 or more of 19 scoring 1–2): completeness, 6 of 19 (31.6%) → FLAG; accuracy, 5 of 19 (26.3%) → FLAG.
Trend flag: accuracy’s cycle means were 3.4 → 3.1 → 2.8 across three consecutive cycles with comparable scoring criteria and population definitions, a net drop of 0.6, meeting the illustrative ≥0.5 review threshold. This is a prompt to investigate, not proof of statistical deterioration: with small samples, a move like this can also arise from sampling variation or a shift in case mix. The flag says “look closer,” nothing more.
Individual records (excerpt):
- Record S-2026-W42-007: scores {3, 4, 3, 4, 2}, mean 3.2 → reviewer flag OK. Note: actionability weak; candidate for a tune.
- Record S-2026-W42-014: CHECK-A2 critical failure → incident track, excluded from aggregate.
- Record S-2026-W42-020: scores {2, 1, 3, 3, 2}, mean 2.2 → completeness scored 1 (unusable as-is) → NEEDS-CASE-REVIEW, even though the cycle mean is Acceptable. This record is one of the six driving the completeness dimension flag.
The story the evidence tells: usable quality overall, but accuracy degrading for three cycles and completeness broadly weak. These are the kinds of early, specific signal that raw system metrics don’t provide.
Reviewer calibration, do this before the first cycle, quarterly, and whenever reviewers change:
- The workflow owner and a qualified domain reviewer agree and record the reference scores for each dimension on five diverse, previously reviewed outputs (the calibration set).
- Each reviewer independently scores all five outputs without seeing those reference scores.
- Illustrative pass criterion: on at least four of the five outputs, every scored dimension is within one point of its reference score. Check dimensions individually, not output means.
- On a fail, discuss meaningful disagreements and have the reviewer score a fresh set of five outputs before production scoring.
- Record who agreed the reference scores, reviewer identity, date, pass/fail, and any rubric clarification. To check drift later, combine a few new blind examples with the fixed reference set rather than relying on memory of the same examples.
This short calibration is the cheapest reliability investment in the whole method. These criteria are an illustrative starting convention and they don’t imply validated inter-rater reliability.
4. Run the measurement cadence
A method you run once is an audit. A method you run every cycle is measurement. Assign three roles. One person may hold multiple roles on a small team, but record the resulting independence limitations:
- Sampler: Pulls the sample according to the plan and owns the population definition.
- Reviewer(s): Score against the rubric; ideally, they should not have built the workflow.
- Log owner: Maintains the results log and produces the cycle summary.
Run the cycle weekly for most teams, or per fixed output volume (e.g., every 200 runs) for high-volume workflows. This scoring cadence sits inside your broader monitoring cadence, which the monitoring framework scales by exposure across automated observation, periodic review, event-triggered review, and human sampling. Time-box scoring sessions. For example, 60 to 90 minutes may be a practical starting point, depending on your sample. Log each cycle: date, sample size, per-dimension means, critical-failure count, band, flags raised, and one paragraph of notes.
Watch the trend, not any single cycle. And resist the temptation to adjust bands to make scores look better, Change the method only when the criteria are outdated or the workflow has changed, never to improve the appearance of the numbers. Two to three stable cycles is the minimum history before touching thresholds.
Independence, the standard and the exception. The standard is independence: the sampler and reviewer should not be the workflow’s builder, and ideally not the same person as each other. On a one-person team that’s impossible. Treat single-operator measurement as a documented deviation, not an equal alternative. Note it in every Cycle Log (“single operator, independence limited”), keep the frozen random selection (you can’t cherry-pick a draw you made blind), preserve all evidence, and monthly blindly re-score five prior outputs without looking at the original scores. Where feasible, arrange a quarterly spot check by someone outside the build. Document the limitation; don’t pretend it away.
5. Hand structured evidence to the monitoring owner
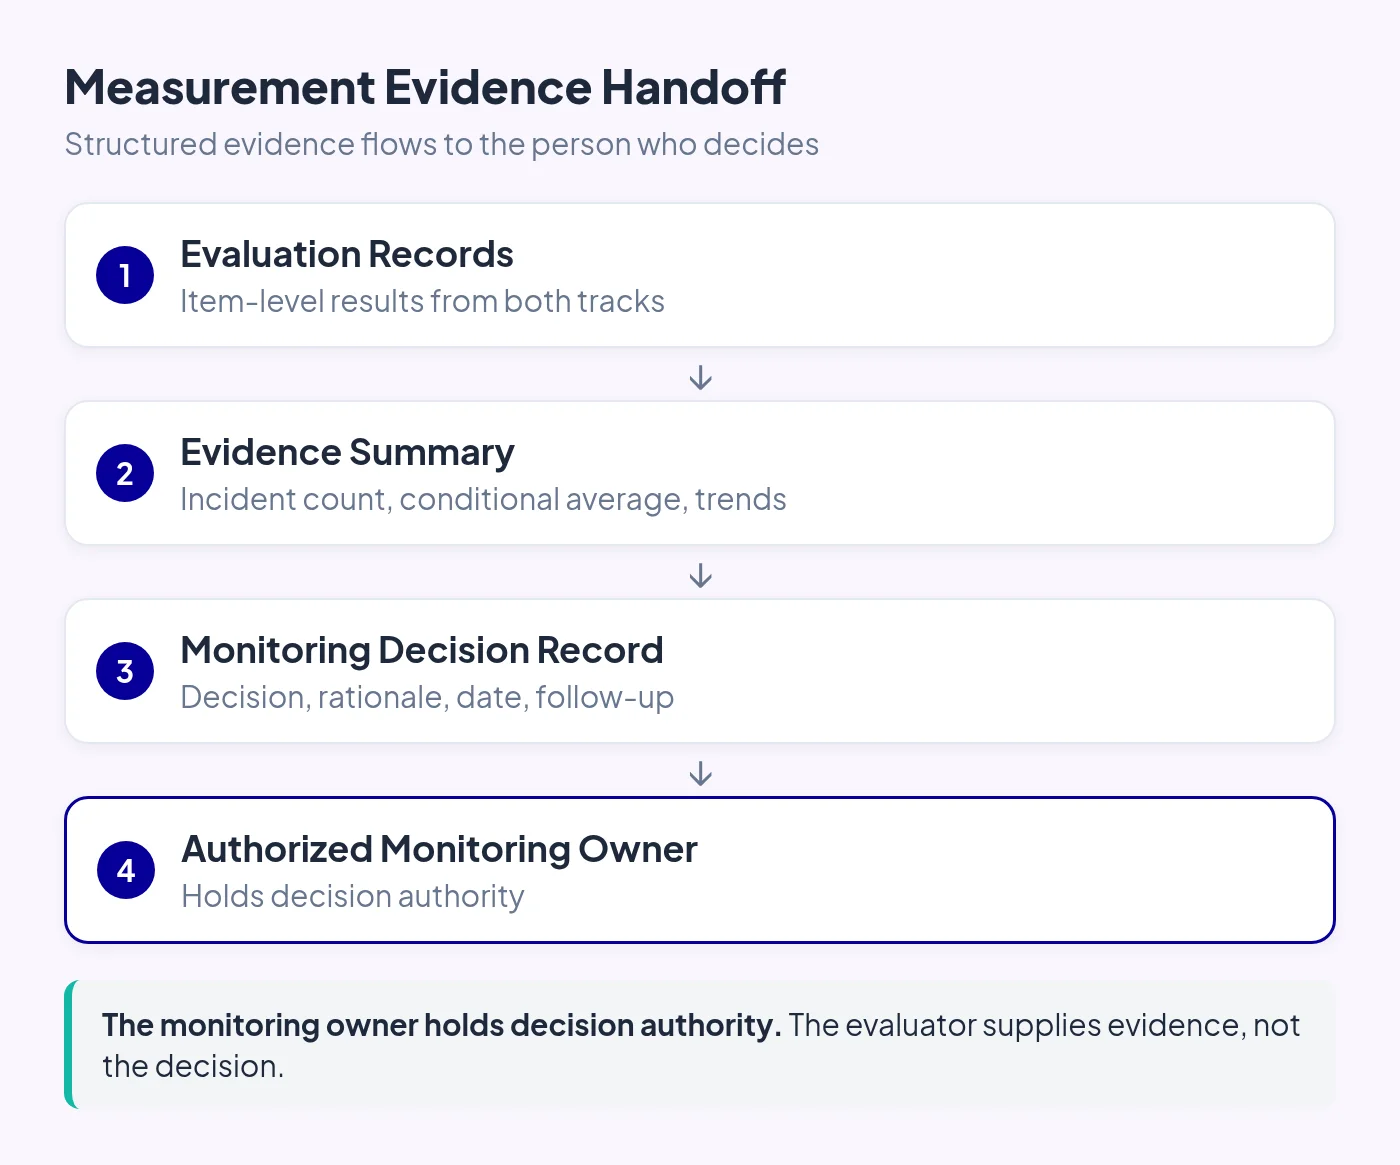
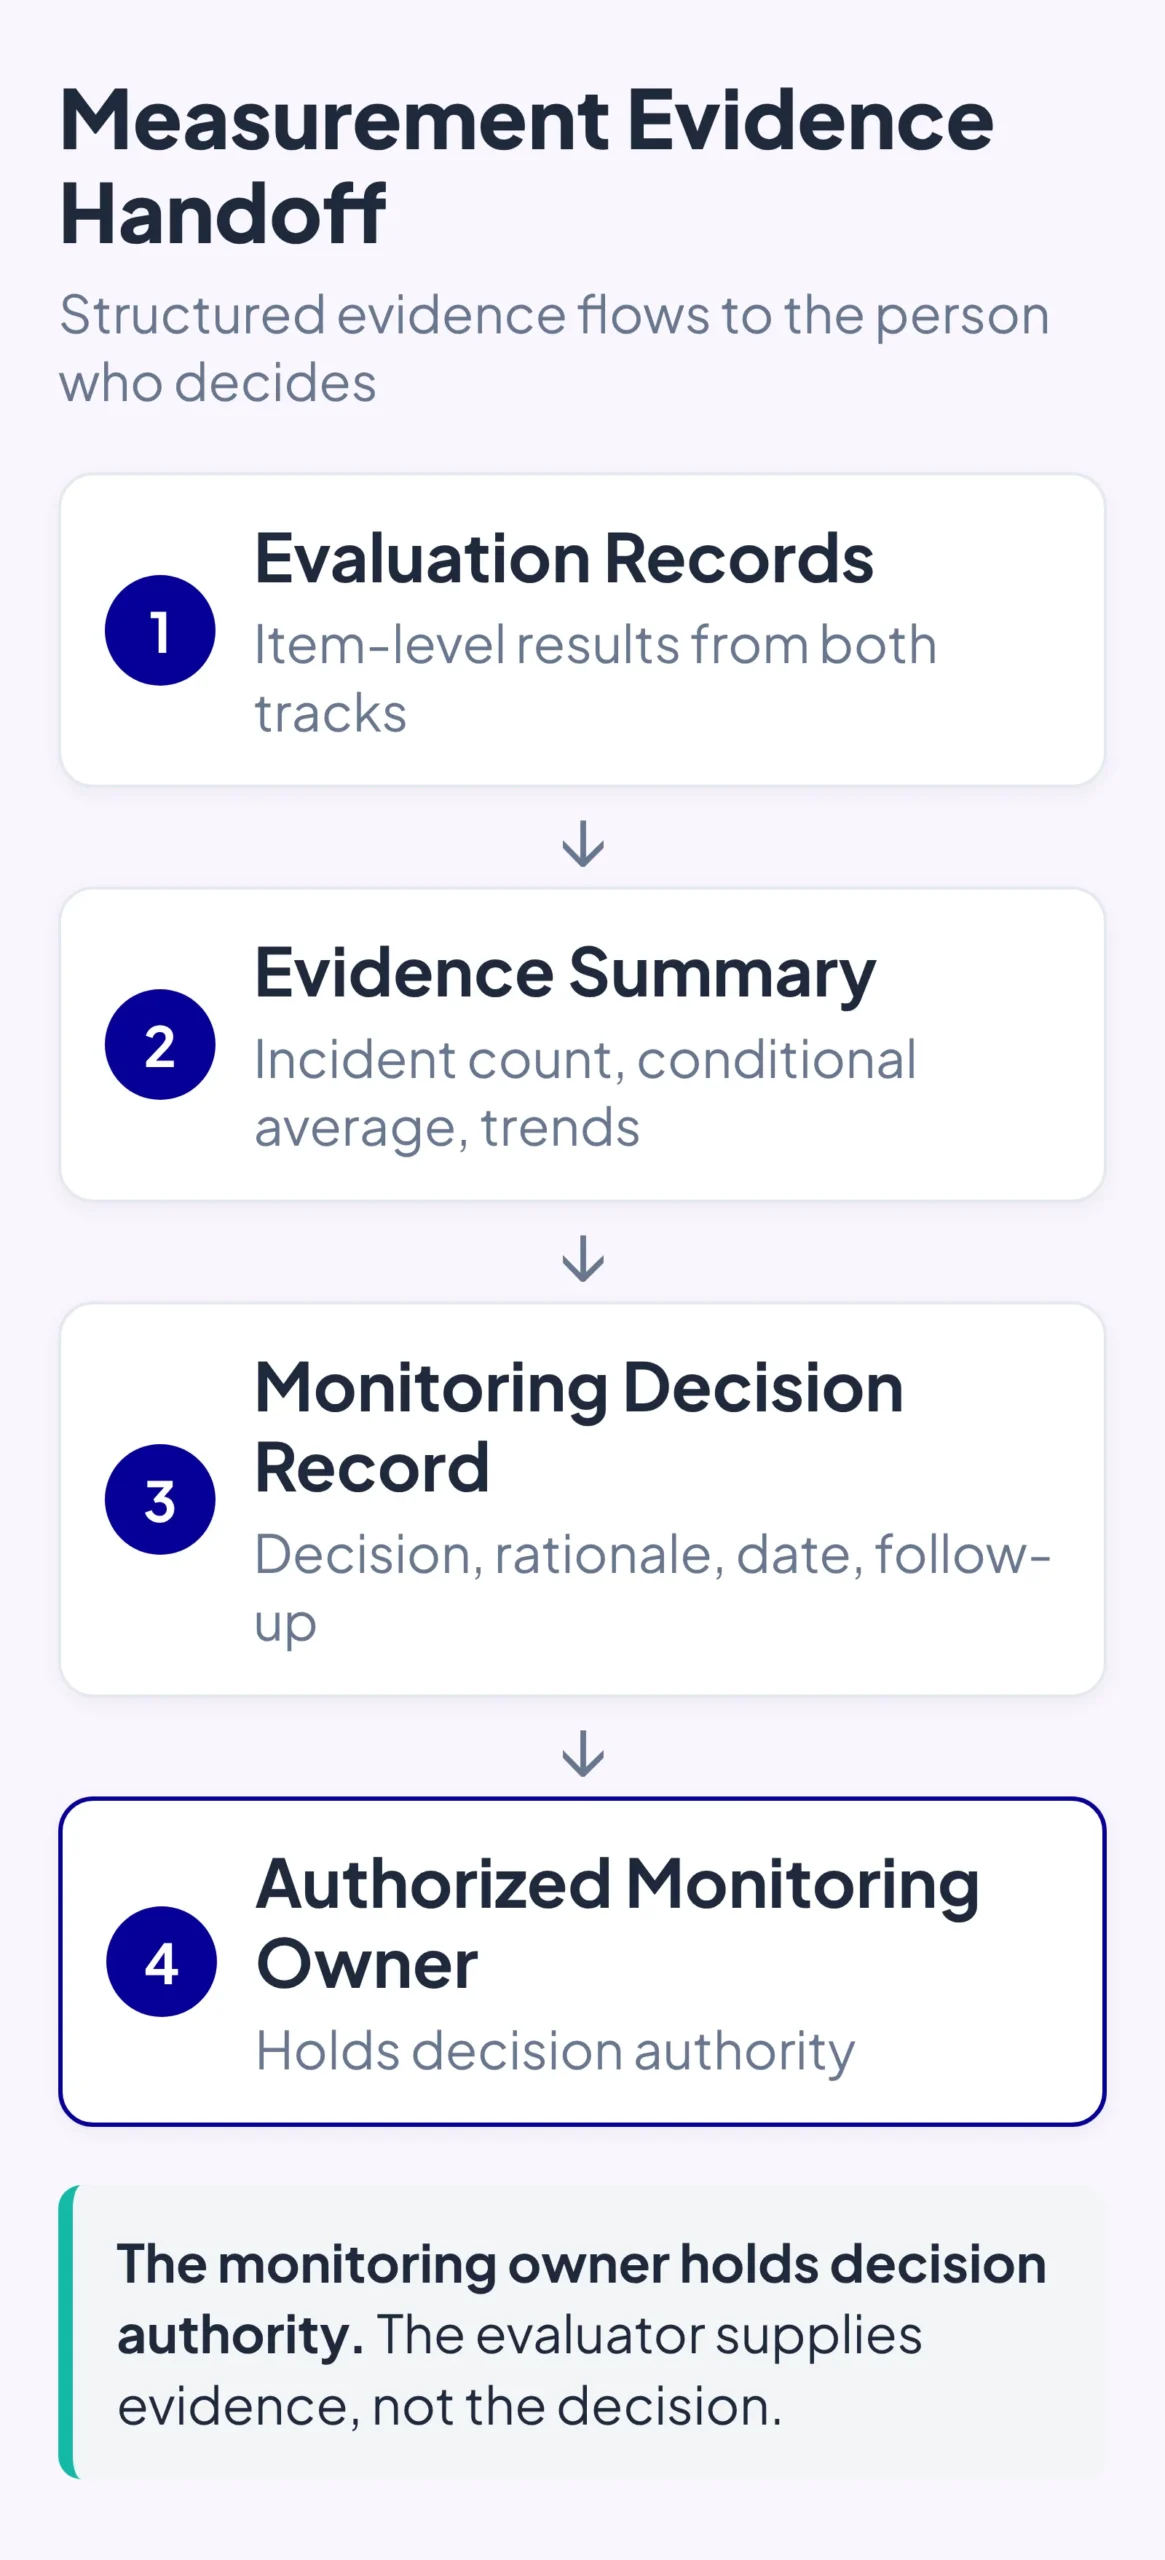
Here is the boundary this entire method respects: evaluation produces evidence; the monitoring owner makes the operating decision. The Operating Basis records the authorized job, scope, version, controls and quality references. The PPF monitoring framework defines three operating states: CONTINUE (evidence supports continued operation under the current Operating Basis), WATCH (uncertainty requires increased, time-bounded attention while operation continues), and INTERVENE (continued reliance under current operating authority is no longer defensible). This article does not redefine them, and no score in this method converts automatically into any of them.
What the monitoring owner weighs, including consequence severity, reversibility, current exposure, control effectiveness, persistence, and sufficiency of the evidence, is the owner’s judgment to make. What this method hands over is the evidence, in a consistent format, ready for the Monitoring Decision Record’s “evidence examined” field:
Cycle 42 evidence summary (n=20, k=1 critical failure at 5.0%, 19 scored, conditional mean 2.9, Acceptable band): accuracy declining three cycles (3.4 → 3.1 → 2.8, investigate flag raised); completeness dimension flagged (31.6% scored 1–2); one CHECK-A2 incident handled with containment confirmed and pattern search complete. Prepared for the monitoring owner’s CONTINUE / WATCH / INTERVENE determination.
Note what this summary does not do: it doesn’t declare WATCH. A WATCH state, under the published framework, requires an assigned owner, a strictly bounded review window, a defined unresolved question, a new evidence plan, and a disposition. That belongs to the monitoring owner’s apparatus, not this method’s. What this method can do is serve as the evidence plan inside a WATCH window: re-measure the flagged dimensions next cycle and report back.
Where evidence identifies weak output quality, the monitoring owner decides whether intervention is warranted. Authorized troubleshooting and change-control processes handle resulting remedies, which may include tighter human review gates. The evaluation record supplies evidence; it does not authorize the remedy.
6. Keep the measurement honest
Every measurement system decays. Name the failure modes upfront so you can spot them:
- Reviewer drift: scores creep upward as reviewers get lenient or rushed. Warning sign: means rise while customer complaints don’t fall. Countermeasure: re-score the fixed calibration set quarterly; investigate drift, don’t celebrate it.
- Sample bias: the sample quietly becomes the easy cases. Warning sign: the sampler starts excluding “messy” tickets. Countermeasure: audit the sampler; verify the sample’s category mix matches the population.
- Rubric gaming: prompts get tuned to score well on the rubric rather than serve the reader. Warning sign: scores rise, reader outcomes don’t. Countermeasure: tie dimensions to reader outcomes (resolution rate, reopen rate), not just rubric aesthetics; refresh example anchors.
- Stale criteria: the workflow’s job changed but the dimensions didn’t. Warning sign: reviewers keep writing “doesn’t apply” in notes. Countermeasure: review dimensions quarterly against what the workflow is actually asked to do.
- Recycled samples: re-scoring the same outputs and calling it a trend. Countermeasure: fresh sample every cycle, enforced by the log owner.
Measurement-integrity checklist: For each cycle, confirm: ☐ fresh sample drawn per plan · ☐ no cherry-picking (independent sampler, or documented single-operator limitation) · ☐ critical failures logged as incidents, excluded from means · ☐ calibration set re-scored this quarter · ☐ bands unchanged or change documented · ☐ dimensions still match the workflow’s job.
What you’ve built
Define quality before measuring it. Sample honestly, at a size you can sustain, remembering the sample is a smoke alarm, not a certificate. Score on two tracks: critical failures as incidents handled through case review and handoff, quality as trends with fully defined bands and honest flags. Run the cadence, and hand structured evidence, not verdicts, to whoever owns the operating decision.
The rubric, sampling record and reviewer guidance can be reused across later cycles, with documented changes when the workflow or criteria change. And when the evidence tells you the workflow was never the right shape to begin with, that’s what pre-production validation and controlled workflow design are for. Measurement signals when to revisit those foundations, not how to redesign them.
Appendix A: Spreadsheet implementation
Two tabs: Records (one row per sampled output) and Cycle Log (one row per measurement cycle). Column letters below match the tested workbook; every formula uses real cell references and works identically in Excel and Google Sheets. The Cycle 42 figures in §3 match a tested spreadsheet fixture (synthetic data constructed to satisfy the published aggregates, not observed data), and every formula below was executed against four scenarios (normal, incident-free, incident-only, and empty cycles) with all results verified.
Records tab
| Col | Field | Definition |
|---|---|---|
| A | cycle_id | Cycle the record belongs to, e.g. 2026-W42. Every row must carry one: this is what scopes all Cycle Log math. |
| B | sample_id | Unique ID per sampled output, e.g. S-2026-W42-007 |
| C | stratum | Sampling stratum, e.g. billing. See stratified sampling below. |
| D | sampled_at | Timestamp of sampling |
| E | workflow_run_id | Source run identifier |
| F | input_reference | Link or ID of the input |
| G | output_reference | Link or ID of the output scored |
| H | sampler | Name/role who pulled the sample |
| I | reviewer | Name/role who scored |
| J | track_a_result | Exactly NONE, or a check ID (CHECK-A1…CHECK-A4). Never leave ambiguous: blank means “not yet checked” and is treated as a data gap, not as an incident and not as scored. |
| K | second_review | Confirming reviewer for suspected critical failures, or N/A with rationale |
| L–P | score_accuracy … score_actionability | Integer 1–4 per dimension; blank for incident rows |
| Q | mean_score | Formula: =IF($J2="NONE",AVERAGE($L2:$P2),""): blank for incident rows, so incident rows can never break the averages |
| R | reviewer_flag | Formula: =IF($J2="NONE",IF(COUNTIF($L2:$P2,1)>0,"NEEDS-CASE-REVIEW","OK"),""): assists the unusable-output rule; reviewer judgment can still override in notes |
| S | reviewer_notes | Free text |
| T | follow_up_action | Owner + due date, or NONE |
Cycle Log tab
| Col | Field | Definition / formula (row 2; the cycle sits in $A2) |
|---|---|---|
| D | n_total | =COUNTIF(Records!$A$2:$A$1001,$A2): rows carrying this cycle_id |
| E | k_incidents | =$D2-$G2-$W2: rows that are neither scored nor data gaps. A blank track_a_result is therefore never counted as an incident; it surfaces in data_gaps instead |
| F | k_over_n | =IF($D2=0,"",$E2/$D2): blank for empty cycles, never #DIV/0! |
| G | n_scored | =COUNTIFS(Records!$A$2:$A$1001,$A2,Records!$J$2:$J$1001,"NONE"): denominator for all means and flags |
| H | mean_conditional | =IF($G2=0,"",AVERAGEIFS(Records!$Q$2:$Q$1001,Records!$A$2:$A$1001,$A2,Records!$J$2:$J$1001,"NONE")): labeled “conditional on exclusion of incident-track outputs” |
| I–M | dm_accuracy … dm_actionability | =IF($G2=0,"",AVERAGEIFS(Records!$L$2:$L$1001,…)): same pattern, one per dimension column (L, M, N, O, P) |
| N–R | flag_accuracy … flag_actionability | =IF($G2=0,"",IF(COUNTIFS(Records!$A$2:$A$1001,$A2,Records!$J$2:$J$1001,"NONE",Records!$L$2:$L$1001,"<=2")/$G2>=0.25,"FLAG","")): same pattern per dimension; the 25% threshold is illustrative |
| S | trend_flag | Manual: INVESTIGATE when a dimension drops a net ≥0.5 across three consecutive cycles with comparable criteria and population; else blank |
| T | band | =IF($H2="","",IF($H2>=3.5,"Strong",IF($H2>=2.5,"Acceptable",IF($H2>=1.5,"Needs tuning","Failing")))): matches the continuous boundaries in §3 |
| U | calibration_due | Date of next quarterly calibration |
| V | independence_note | e.g. independent sampler/reviewer, or single operator: independence limited, blind re-score applied |
| W | data_gaps | =COUNTIFS(Records!$A$2:$A$1001,$A2,Records!$J$2:$J$1001,""): rows needing attention before the cycle summary is trusted |
| X | evidence_summary | One-paragraph handoff text for the Monitoring Decision Record |
Before using the workbook for new cycles: Copy Records formulas in columns Q–R down to every new record and copy Cycle Log formulas into each new cycle row. Expand $1001 range limits before recording more than 1,000 outputs. Do not finalize a cycle if a NONE (non-incident) record has any blank or nonnumeric score in L–P: the formulas do not automatically detect incomplete dimension scoring and may otherwise report a misleading mean. Similarly, investigate every data_gaps entry and any unrecognized Track A check ID. The supplied workbook is a synthetic demonstration fixture, not evidence of real workflow results.
Why the formulas are built this way. Every Cycle Log formula filters on the row’s cycle_id, so any number of cycles can share one workbook without cross-talk. Incident counting uses subtraction (k = n − scored − gaps) instead of not-equal criteria, so blank fields can never inflate the incident count. Every division and average is guarded by an IF, and incident rows leave their score cells blank. The four tested scenarios (normal, incident-free, incident-only, and empty) produce no #DIV/0! errors.
Stratified sampling: allocation without biased aggregates
- Define strata before sampling (e.g.,
billing,technical,account) and record the population share of each. - Proportional allocation: run the random procedure separately inside each stratum’s ID list, drawing each stratum’s share of N. This keeps the sample representative without any weighting math.
- Supplementary samples: where a stratum is small but analytically important, you may draw extra records beyond its proportional share, but report that stratum separately and never fold the oversampled records into the headline cycle mean. An oversampled aggregate is not a population estimate.
- Document stratum definitions, allocation, and any supplementation in the Cycle Log’s
sampling_procedurefield.
Random and systematic sampling: procedure and reproducibility limits
Random (default):
- Export all workflow run IDs for the cycle period into a Population sheet, including fully automated outputs no human touched.
- In a helper column beside each ID, enter
=RAND(); copy the column and paste-as-values immediately to freeze it. - Sort ascending by the helper column; take the top N rows per your stratum allocation.
- Record N, the date, and this procedure reference in the Cycle Log. Preserve the sheet because its frozen key column records exactly which draw was used.
Reproducibility, stated honestly: the procedure is reproducible. Anyone repeating these steps on the same population export gets a fresh random sample. The specific draw is preserved by the frozen key column, not by re-running: RAND() is not seedable in Google Sheets, so the preserved sheet is the record. If you need the identical draw later (e.g., for an audit re-check), refer to the preserved sheet; don’t re-run.
Systematic (alternative): take every m-th run where m = ROUND(population ÷ N), starting from a random position between 1 and m. Avoid this if the population has a periodic ordering that could align with m (e.g., batched exports).
Exclusions: declare before sampling and document in the Cycle Log (e.g., “staging/test traffic excluded”, “outputs from declared incident window 2026-10-08 already under separate review”). An undocumented exclusion is a bias.
Incident-record fields
incident_id · sample_id · check_id (CHECK-A1…A4) · detected_at · reached_customer (YES / NO / UNKNOWN) · containment_action · pattern_search_done (YES / NO) · owner · follow_up_due · handoff_ref (monitoring/troubleshooting ticket).
Put this method to work
If your team runs AI-assisted workflows and needs help defining dimensions, sampling plans, rubrics or review cadences, request a workflow audit and we’ll map where measurement fits in your operation.